

- September 18, 2023
- Business, Data Science, Data Visualization, Google Looker Studio, Reports, Technology
Looker Studio is a robust data visualization tool that empowers users to craft engaging and interactive dashboards and reports. Whether you’re a novice or an experienced data enthusiast, Looker Studio offers an intuitive interface and a wide array of features. You can effortlessly merge data from multiple sources, create bespoke calculations, and seamlessly collaborate by sharing your reports with others.
Step-by-Step Guide: Creating a Report in Looker Studio
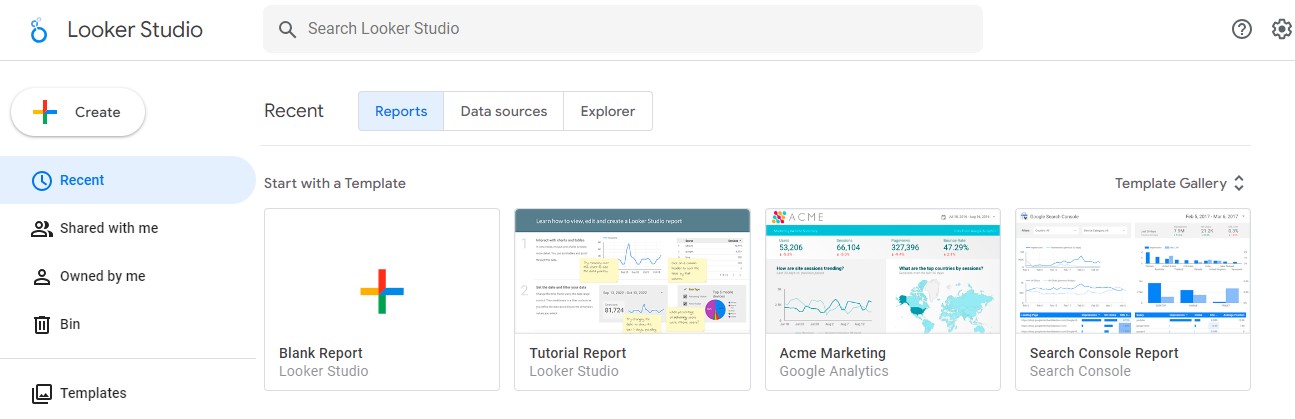
- Sign in to Looker Studio and click the Create button.
- Select Report and click Create.
- In the Add data to report panel, choose a data source.
- Click Connect.
- Select the fields you wish to include in your report and click Add.
- Navigate to the Report canvas tab.
- Choose the chart type you want and place it on the canvas.
- In the Properties panel, pick the dimensions and metrics for your chart.
- Customize the chart to suit your preferences.
- Don’t forget to hit Save.
Once your report is ready, you can easily share it with others by clicking the Share button and providing their email addresses. You can also export your report to a PDF or CSV file.
Pro Tips for Crafting Reports in Looker Studio
- Use filters to focus on specific subsets of your data.
- Leverage calculated fields to create new metrics or dimensions.
- Implement parameters to enable users to interact with your reports and filter data dynamically.
- Enhance the aesthetics with themes and styles to match your brand or preferences.
If you’re eager to delve deeper into Looker Studio, you’ll find a wealth of online resources, including comprehensive Looker Studio documentation and informative tutorial videos. Start your journey to becoming a Looker Studio pro today!