Business Code Data Science Data Visualization Google Analytics Google Analytics 4 - GA4 Google Cloud Google Looker Studio Google merchant center Google tag manager Prestashop Reports Server-Side Tracking Technology web design web development
Build It, Track It, Grow It: Websites by Palam Solutions
Palam Solutions: Empowering Small Business Success with Expert Web Solutions In today’s digital era, having a strong online presence is not just a luxury; it’s a necessity for businesses, regardless of their size. For small enterprises, a well-designed and functional website can be a game-changer, offering a myriad of benefits that contribute to growth, visibility,…
Business Code Data Science Data Visualization Google Ads Google Analytics Google Analytics 4 - GA4 Google Looker Studio Google tag manager
Beyond the Cookie Crumbles: Conquering Cross-Domain Tracking on Salesforce
Cross-domain tracking plays a crucial role in understanding user journeys and measuring marketing effectiveness. However, implementing it on Salesforce pages comes with its own set of challenges, often leaving businesses perplexed and wondering: “Can I even track across domains with Salesforce?” The answer, like most things in marketing, is nuanced. While it’s undeniably more…
Navigating the Event-Driven Data Landscape: Choosing the Right Platform
In the dynamic realm of data analytics, the transition from session-based to event-based data collection has revolutionized the way businesses understand and measure user interactions. Event-based data, capturing every granular interaction rather than just page views or sessions, provides a more comprehensive and nuanced view of user behavior, enabling businesses to make data-driven decisions that…
Business Data Science Data Visualization Google Ads Google Analytics Google Analytics 4 - GA4 Reports Server-Side Tracking Social Media Technology
No More ROI Mystery: Cracking the Code of Conversion Values
In the dynamic realm of digital marketing, understanding the value of online conversions is crucial for optimizing campaigns and maximizing ROI. Every conversion, whether it’s a purchase, a form submission, or a signup, represents a step towards achieving business goals. By assigning a monetary value to each conversion, marketers can gain a clear understanding of…
Artificial Intelligence Business Data Science Data Visualization Google Analytics Google Analytics 4 - GA4 Google Cloud Google tag manager Server-Side Tracking Technology
Beyond the Cookie Crumble: Why Smart Brands are Switching to Google Cloud Server-Side Tracking
In the ever-evolving landscape of digital analytics, a quiet revolution is brewing. Server-side tracking, particularly through platforms like Google Cloud, is rapidly gaining traction as brands seek to navigate the murky waters of privacy regulations and data security concerns. But what exactly is this buzzword, and why is it suddenly causing such a stir? Buckle…
Artificial Intelligence Business Code Data Science Data Visualization Google Cloud Natural Language Processing NLP
How to Become a Cloud Computing Expert – Step-By-Step Guide
In today’s rapidly evolving technological landscape, cloud computing has emerged as a critical component, revolutionizing the way businesses operate and manage their data. As organizations increasingly migrate to the cloud, the demand for skilled professionals in cloud computing is soaring. This article serves as a roadmap for those aspiring to become cloud computing experts, providing…
Demystifying the Discrepancies in Conversion Dates Between Google Ads and Google Analytics
In the dynamic world of digital marketing, accurately tracking and measuring campaign performance is crucial for optimizing strategies and maximizing ROI. However, discrepancies between conversion dates in Google Ads and Google Analytics can often lead to confusion and hinder effective decision-making. Understanding the reasons behind these discrepancies is essential for marketers seeking to reconcile their…
Maximize Conversions: A Comprehensive Guide to Boosting Your Marketing ROI
In the dynamic realm of digital marketing, maximizing conversions is the ultimate goal for businesses seeking to enhance their online presence and drive profitable outcomes. This objective entails understanding the intricate customer journey and implementing effective strategies to transform potential leads into loyal customers. What is Maximize Conversions? Maximize Conversions is an automated bidding…
Data-Driven Attribution: Unveiling the Secrets Behind Conversion Success
In the ever-evolving landscape of digital marketing, understanding how your various marketing efforts contribute to conversions is crucial for optimizing your campaigns and maximizing ROI. Traditional attribution models, such as last-click attribution, often fail to capture the complex customer journey, leading to inaccurate assessments of campaign performance. This is where data-driven attribution (DDA) emerges as…
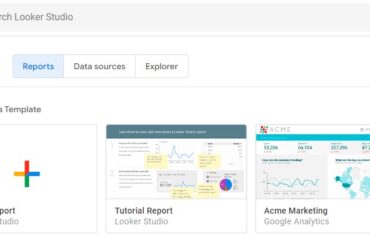
Mastering Interactive Data Reports with Looker Studio: A Step-by-Step Guide
Looker Studio is a robust data visualization tool that empowers users to craft engaging and interactive dashboards and reports. Whether you’re a novice or an experienced data enthusiast, Looker Studio offers an intuitive interface and a wide array of features. You can effortlessly merge data from multiple sources, create bespoke calculations, and seamlessly collaborate by…


