Loading Data into BigQuery: Methods & Techniques
Welcome to our comprehensive guide on loading data into Google BigQuery, the powerful data analytics platform. In this tutorial, we’ll walk you through three efficient methods: uploading data from local files, loading data from Google Cloud Storage, and streaming data in real-time for instant analysis. Let’s dive in! 1. Uploading Data from Local Files:…
Getting Started with BigQuery: Account Setup & Project Creation
Welcome to the world of BigQuery, Google’s powerful data analytics tool. In this tutorial, we’ll walk you through the essential steps to get started: creating a Google Cloud account, setting up billing, creating a new BigQuery project and dataset, and introducing you to the BigQuery Console UI. Let’s dive in! Step 1: Creating a…
Bigquery Business Data Science Data Visualization Google Analytics Google Analytics 4 - GA4 Google Cloud Reports Technology
How BigQuery Fits into the Larger Google Cloud Ecosystem
In the realm of data analytics, the seamless integration of tools within a comprehensive ecosystem is pivotal. Google BigQuery, a powerhouse data analytics tool, stands as a shining example of such integration within the broader Google Cloud framework. In this article, we’ll delve into how BigQuery fits seamlessly into the Google Cloud ecosystem, amplifying its…
Introduction to BigQuery: Unveiling Google’s Powerful Data Analytics Tool
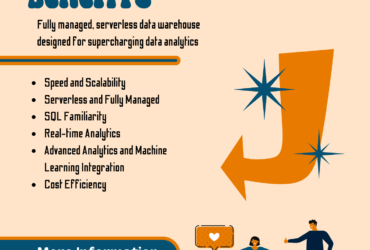
In the realm of data analytics, efficiency and speed are paramount. Enter Google BigQuery, a cutting-edge cloud-based data warehousing solution that empowers businesses to analyze massive datasets at lightning speed. In this article, we’ll delve into the world of BigQuery, uncovering its significance, key features, benefits, and its seamless integration into the broader Google Cloud…
How to Customize Metrics in Google Analytics 4 (GA4) Detail Reports
Google Analytics 4 (GA4) provides robust reporting capabilities to help you analyze and understand your website’s performance. One of the key features is the ability to customize metrics in detail reports. This tutorial will guide you through the process of adding, removing, and organizing metrics in the table header of a detail report. Additionally, you’ll…
Demystifying GA4 Recommended Events: A Comprehensive Guide
As the digital landscape evolves, harnessing the power of data-driven decision-making has become essential for businesses seeking to thrive in a competitive market. Google Analytics 4 (GA4) has emerged as a game-changing tool, offering advanced features to capture user behavior and gather insights. Among these features are GA4 Recommended Events, a curated list of events…
Unveiling the Future of Analytics: Introducing GA4 Reports Builder
In the ever-evolving landscape of digital analytics, staying ahead of the curve is essential to unlocking the true potential of your data. Google Analytics has long been a cornerstone for businesses seeking to understand their online presence, user behavior, and marketing performance. Now, with the launch of GA4 Reports Builder, a new era of data…
Business Data Visualization Google Analytics Google Analytics 4 - GA4 Google Looker Studio Google tag manager
Streamlining Insights: Harnessing the Power of Google Analytics Automated Reports
In today’s digital landscape, data is the fuel that propels businesses forward, providing invaluable insights into user behavior, website performance, and marketing efficacy. Google Analytics, the premier web analytics service, has revolutionized the way organizations gather and interpret this data. One of its standout features, Google Analytics Automated Reports, has emerged as a game-changer, enabling…


